
Create Flow Charts with Coggle
A flow-chart, or process diagram, is a way of illustrating the steps necessary to complete a task.

Tip: This guide is for using Coggle in the brower on desktop, on mobile devices long-press to open the context menu or add items instead of right-clicking.
Some of the shapes used in this example are included in our paid plans. The rectangle, oval and pointed-rectangle shapes are all included in our free plan.
Creating a Flow Chart in Coggle
1. Create a New Diagram
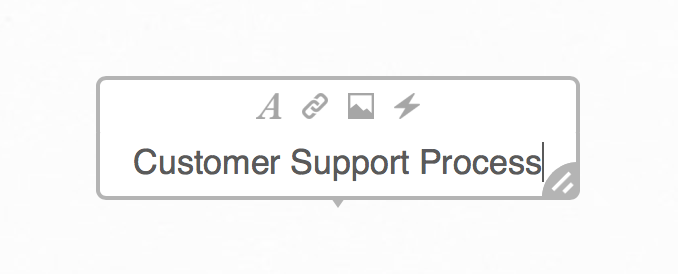
2. Give the flow chart a title
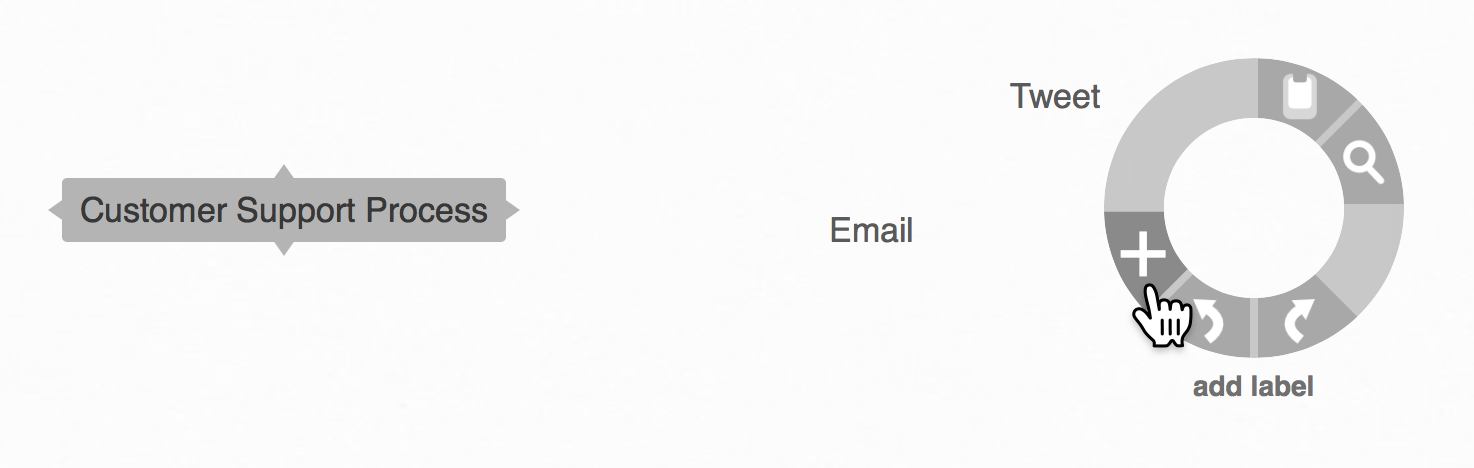
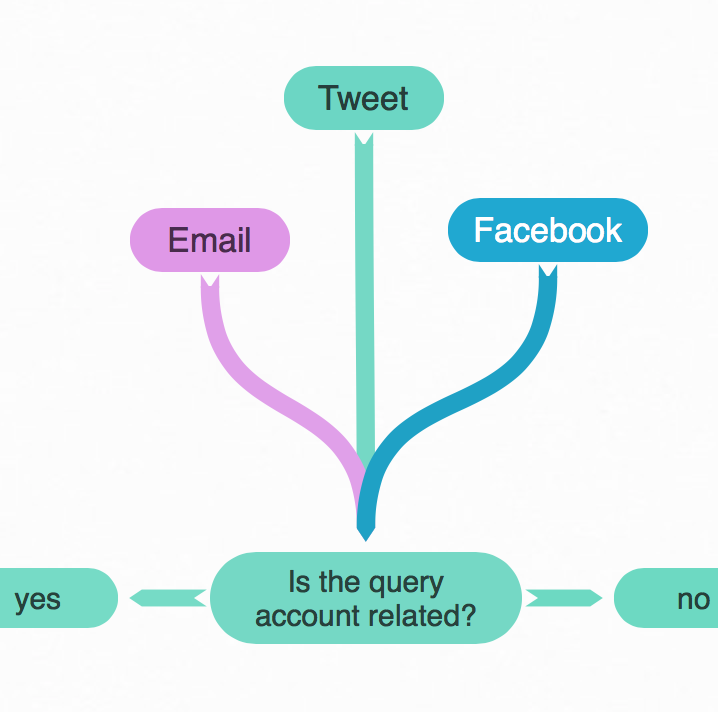
3. Create the top-level items in your flow-chart.
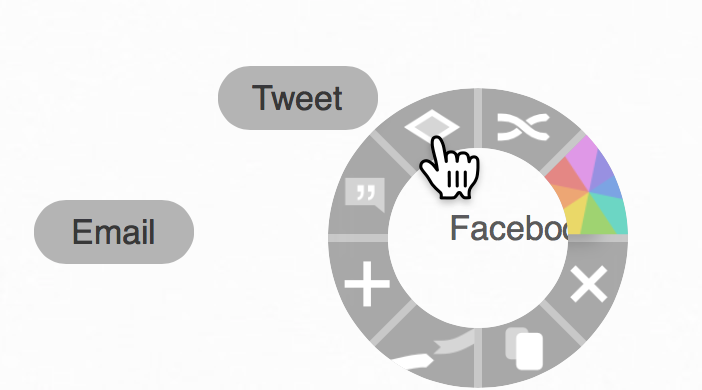
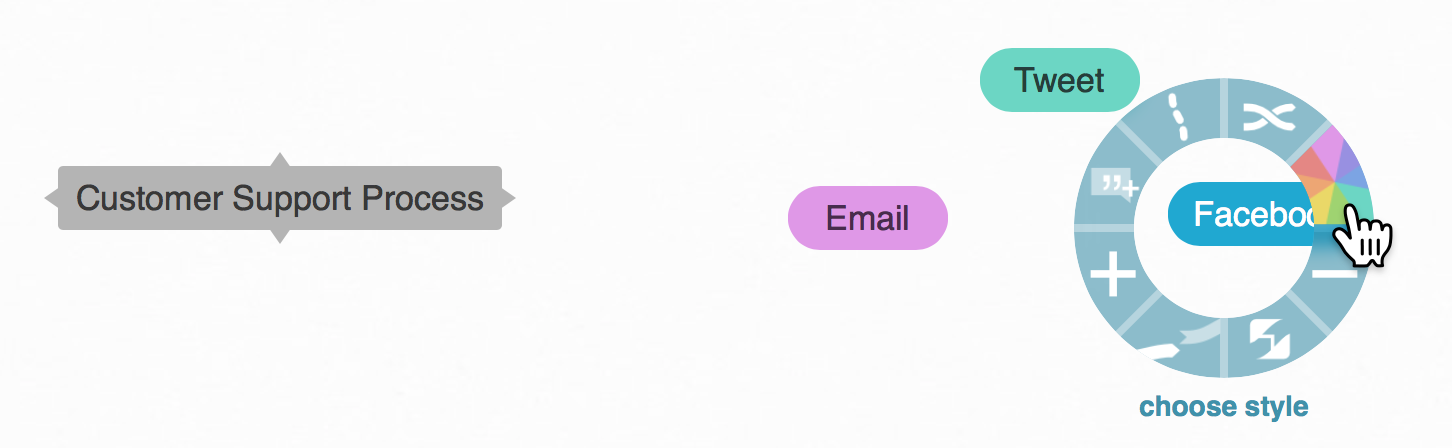
4. Choose the style of items.
5. Create the next steps in the flow
Use the (+) buttons on items to create connected items, then give them labels:

6. Join items together
7. Creating 'in-line' items on branches
We want the 'yes' and 'no' items to be simple labels on the branches, rather than items in themselves. To do this, choose the option in the shape menu:

8. Add and connect more items
Continue to add and connect items until your flow chart is complete! Change the shapes and colours of items to indicate their meaning or importance to you (red is a great colour for very important steps!)
Tips:
- to change the colour of just one item, hold the [shift] button when selecting the colour.
- If you find the arrow on a connection is giong in the wrong direction, right click on the connection, and choose the 'reverse connection' option.
View or create your own copy of the complete diagram from this example here: https://coggle.it/diagram/W3iq_EjpB17JPXIf/t/customer-support-process